Solar Spectrum, N.A. Sharp, NOAO
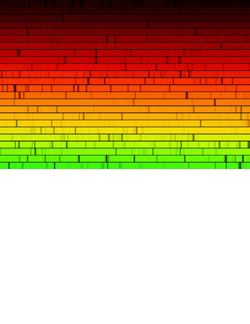
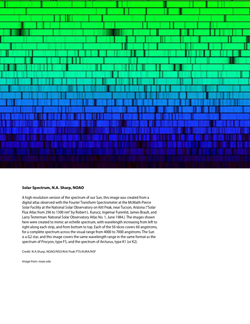
A high resolution version of the spectrum of our Sun, this image was created from a digital atlas observed with the Fourier Transform Spectrometer at the McMath-Pierce Solar Facility at the National Solar Observatory on Kitt Peak, near Tucson, Arizona (“Solar Flux Atlas from 296 to 1300 nm” by Robert L. Kurucz, Ingemar Furenlid, James Brault, and Larry Testerman: National Solar Observatory Atlas No. 1, June 1984.). The images shown here were created to mimic an echelle spectrum, with wavelength increasing from left to right along each strip, and from bottom to top. Each of the 50 slices covers 60 angstroms, for a complete spectrum across the visual range from 4000 to 7000 angstroms. The Sun is a G2 star, and this image covers the same wavelength range in the same format as the spectrum of Procyon, type F5, and the spectrum of Arcturus, type K1 (or K2).
Credit: N.A.Sharp, NOAO/NSO/Kitt Peak FTS/AURA/NSF
Image from: noao.edu


