LAB 5 is out
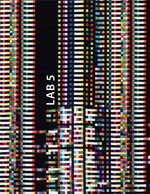
What’s in LAB 5? Everyone Ever in the World, and other data visuals by Peter Crnokrak. Deconstructed dialogue from Coffee and Cigarettes. Romeo & Juliet, recontextualized. Wind diagrams and 3D soundscapes. Glitchometry and glitch textiles. An artists who paints with sound. The color palettes of Gaugin and Monet. Iohanna Pani’s Form Follows Data, where cups and plates become personal data visuals. What else? Kaleidoscopic architectural photography, demographic statistics as ceramic jars, and city plans playfully organized by block shape.
real-time trending data
Google has released a colorful new visualization of what’s currently trending in Google Searches. Searches can now be displayed full screen in Google Trends.
If you click the View menu (white grid, upper left corner) and select Enter Presentation Mode, you’ll get a mosaic of real-time trending data, screen-saver style.
LAB 6
What’s in LAB 6? All The Faces of Facebook and data visuals from Interactive Things. Wood textiles, ceramic sculpture, and breathing metal. Generative jewelry and smart foil. Jenny Odell’s Satellite Collections and ESA’s Satellite Connections. Shakespeare is googled and the lives of painters are visualized. Topics ranging from nano-technology to fractal branching to solar spectrum analysis. Finally, pulling back, NASA gives us a stunning image of this beautiful blue marble called Earth as it rotates around the sun at 67,000 mph.