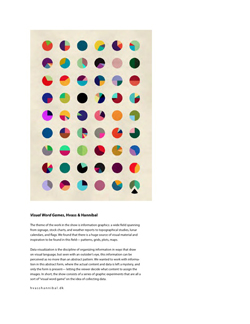
The theme of the work in the show is information graphics: a wide field spanning from signage, stock charts, and weather reports to topographical studies, lunar calendars, and flags. We found that there is a huge source of visual material and inspiration to be found in this field— patterns, grids, plots, maps.
Data visualization is the discipline of organizing information in ways that draw on visual language, but seen with an outsider’s eye, this information can be perceived as no more than an abstract pattern. We wanted to work with information in this abstract form, where the actual content and data is left a mystery, and only the form is present— letting the viewer decide what content to assign the images. In short, the show consists of a series of graphic experiments that are all a sort of “visual word game” on the idea of collecting data.