What do billions of Instagram photographs tell us about the world? How can we see larger cultural patterns contained in such massive visual social data? Do these images reflect the specificity of local places?
A group of researchers from the Art History department at the University of Pittsburgh, the Software Studies Initiative at California Institute for Telecommunication and Information and the Computer Science program at The Graduate Center, City University of New York collaborated to investigate these questions.
Their research is the first academic study to investigate Instagram’s big visual data. The result is a project called Phototrails (phototrails.net), which developed advanced visualization techniques to analyze and compare more than 2.3 million publicly shared Instagram photos from 13 cities such as New York, San Francisco, London, and Tokyo.
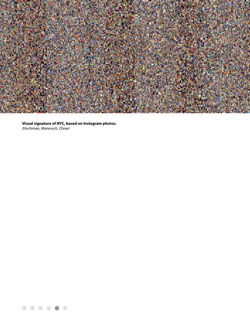
The researchers found that each city has its own unique “visual signature” on Instagram. Based on measurements of multiple visual attributes such as hue, brightness, and line orientation, Bangkok was found to be the most visually different from other cities, followed by Singapore, and Tokyo.
“Our visualizations allow us to uncover the aggregated visual characteristics of each city as well as to examine the impact of exceptional events such as hurricane Sandy”, says Nadav Hochman a Ph.D. student in the History of Art and Architecture department at the University of Pittsburgh.
The study also looked at the patterns of Instagram use among 312,694 people during a four months time period. The great majority of people only uploaded one or a few photos. The proportions of these active users vary significantly from city to city. For example, the percentages of people who uploaded more than 30 photos are 2% in NYC, 6.7% in Moscow, and 10.9% in Tel Aviv.
The researchers also found differences in the use of Instagram filters. In their sample, the proportion of photos to which Instagram users applied filters varies between 68 and 81 percent. The cities with the highest percentage of filtered photos are Tel Aviv, London, and San Francisco, while the city with lowest percentage is New York.
The team’s findings are published in the July issue of First Monday (firstmonday.org), an open-access, peer–reviewed journal. In addition, all visualizations and findings are available on the project’s web site at phototrails.net.
The project is a collaboration between Nadav Hochman (PhD student, History of Art and Architecture University of Pittsburgh), Lev Manovich (Professor, The Graduate Center, CUNY, and Director of Software Studies Initiative at Calit2), and Jay Chow (graduate of the Interdisciplinary Computing and the Arts undergraduate program at UCSD). •